The development of dashboards and reports is a central component of modern business intelligence projects. It requires not only technical know-how but also structured project management to efficiently align the different requirements of business units, IT, and management. Choosing the right project management method – traditional (waterfall) or agile – is critical for project success.
Dashboards and reports are interfaces between data and decision-makers. They must not only function technically but also be intuitive, flexible, and up to date. The development of such solutions is often characterized by:
A key success factor in developing dashboards and reports is a deep understanding of actual requirements. Only when project managers and other key roles know exactly what and for whom they are developing can solutions with real added value emerge. It is essential that involved individuals work closely with the business units, understand day-to-day challenges, and clearly grasp stakeholder goals[1][5][7].
Especially when key roles like project management, requirements management, or development are outsourced to distant countries, there is a risk of losing this understanding. Language, cultural, and professional barriers can lead to misunderstandings, missed details, or unrecognized user goals — resulting in dashboards and reports that miss the mark and are poorly accepted[1][5][7].
Therefore: proximity to the business, the ability to question requirements, and refine them with end users is critical for success – and rarely replaceable by technical specifications or remote teams. For sustainable project success, key roles should ideally be placed close to the business and work in close coordination with stakeholders.
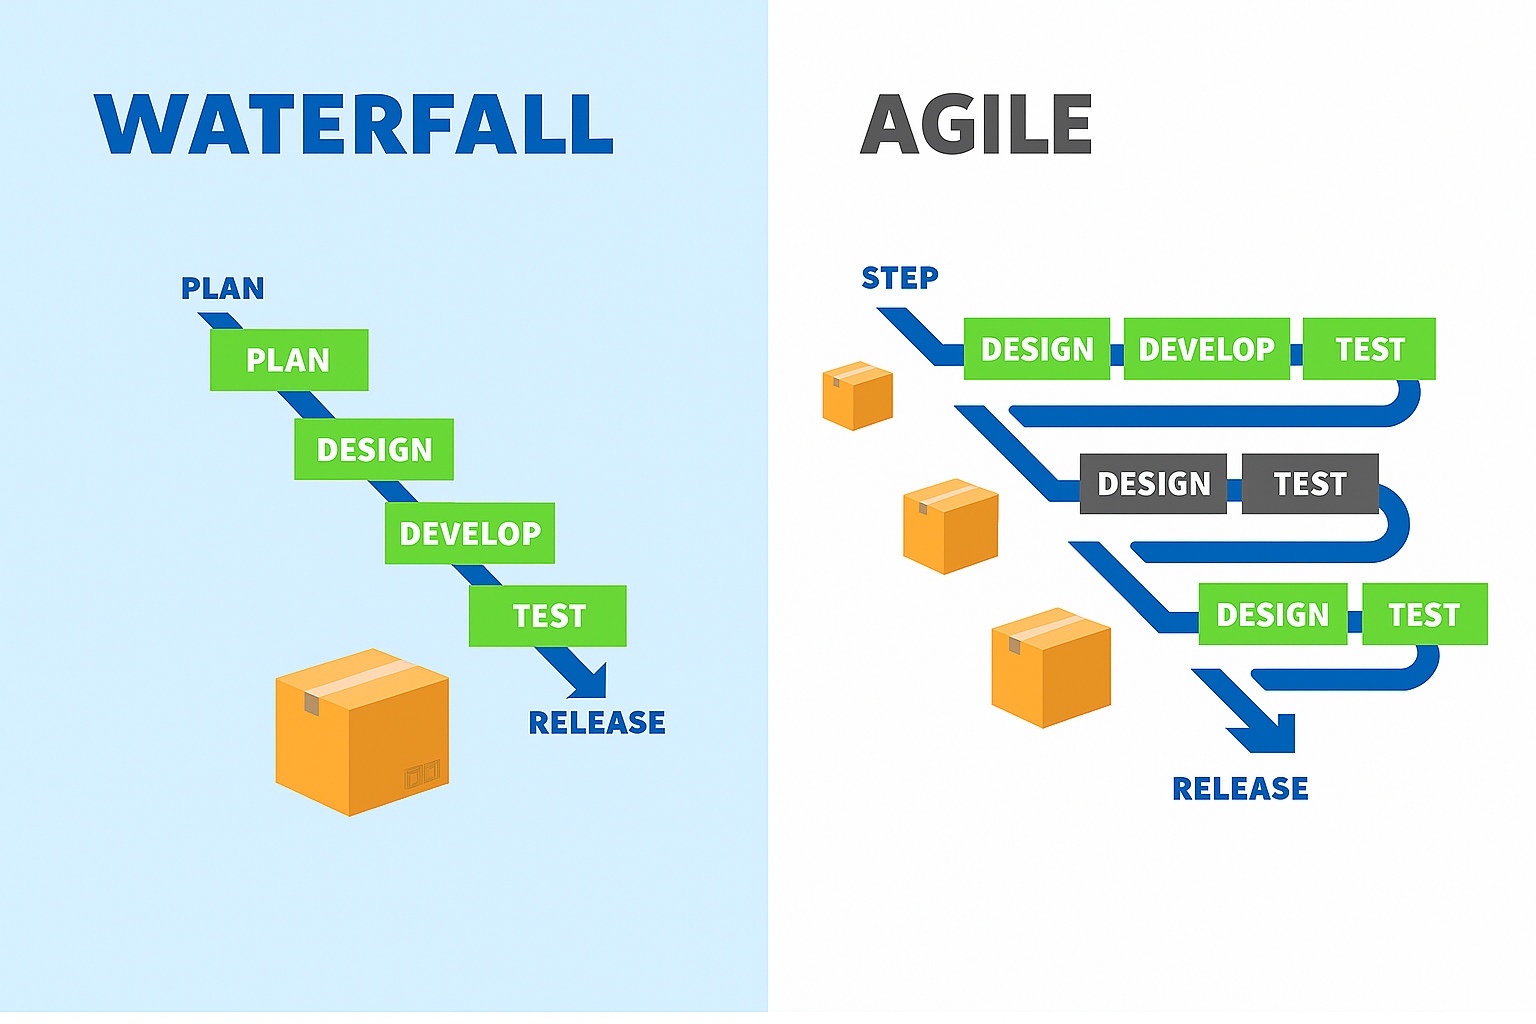
The waterfall model is a classic, sequential approach to project management. It divides the project into clearly defined phases, completed one after the other:
Advantages:
Disadvantages:
Agile methods like Scrum or Kanban rely on incremental, iterative development and close collaboration with stakeholders. Work is divided into short cycles (sprints), each ending with a usable (partial) result.
Advantages:
Disadvantages:
| Criterion | Waterfall | Agile |
|---|---|---|
| Requirements management | Once at the beginning, changes difficult | Ongoing, changes welcome |
| Feedback | At start and end | Continuous, after each sprint |
| Flexibility | Low | High |
| Time to first result | Long | Short, incremental |
| Stakeholder involvement | Low, sporadic | High, regular |
| Risk of misdevelopment | High | Low |
| Documentation effort | High | Focused on essentials |
“Agile methods usually offer significantly more value in dashboard and report development because they emphasize flexibility and user focus. In some cases – such as clear regulatory requirements – the waterfall model may be the better choice.”
Developing dashboards and reports is an iterative process that thrives on clear goals, close coordination with stakeholders, and a suitable project management method. While the waterfall model has advantages when requirements are stable, the agile approach is usually superior in dynamic BI environments. Regardless of method, it is essential that involved individuals truly understand user requirements and goals – and stay close to the business. Outsourcing key roles can jeopardize this understanding and should be considered carefully. Ultimately, the specific project situation decides – a hybrid approach combining the strengths of both may be the key to success.